FYI.

This story is over 5 years old.

Tech

The Biggest Dead Zones in America's Waterways

Getting personal with America’s largest dead zones.
Historic eutrophic and hypoxic zones, from the World Resources Institute's interactive map

The NOAA forecasted that this year’s Gulf of Mexico hypoxic “dead” zone will be between 7,286 and 8,561 square miles—one of the ten largest on record. What’s worse is the Gulf isn't alone: dead zones, in which low oxygen causes high fish mortality, are proliferating all over the world. According to the World Resources Institute, there are 479 hypoxic waterways worldwide.

Many of the United States' coastal waterways experience eutrophic (high nutrient) and hypoxic conditions. Hypoxia is usually caused by abnormal influxes of nutrients into a waterway, which cause algae blooms that initially reduce aquatic oxygen levels through respiration. Additionally, algae on surface waters blocks light from getting to marine plant life. Without light there is no photosynthesis, and without photosynthesis, underwater plants can’t produce oxygen.

Advertisement

Once the algae consumes all the surface level nutrients, it dies, sinks to the bottom of the body of water and rots. Bacteria decomposes the algae and in the process sucks up all the underwater oxygen. At this point fish start dying en mass and the underwater ecosystem is thrown into chaos. In the US, excess nutrients in waterways usually arrive via sewage plants, and nitrogen and phosphorous-based fertilizers washed away with agricultural run-off.

“Up until a decade ago nitrates have been under the radar,” said Mindy Selman, a senior associate at the World Resources Institute. “They're bad as they accumulate in the water, but they're not toxic, so they weren't regulated. Now people are seeing the impacts, so now they're starting to put limits on how much phosphorous or nitrogen can be output.”

Key areas where federal and state authorities have started to take notice are the Chesapeake Bay, Long Island Sound, Great Lakes, and coastal Oregon. While each of these regions share similar conditions, their causes and treatment plans are quite different. Below is a tour of the United States most hypoxic regions outside of the beleaguered Gulf Coast.

Chesapeake Bay

We often bemoan the ecological tragedies plaguing the Gulf Coast—oil spills, industrial waste, overfishing—but the East Coast is not so far behind. From the tip of Florida all the way up to Canada, the Atlantic Ocean suffers from hypoxia, largely due to farm run-off both from animal waste and overuse of chemical fertilizer.

Advertisement
Dead menhaden float in the Bay in this 1973 EPA photo

One of the biggest areas that has garnered attention at the federal level is the Chesapeake Bay, which is surrounded by four major farming states: Pennsylvania, Delaware, Maryland, and Virginia. The 88,000 farms in the region contribute a lot of nitrogen into the watershed, often through storm run-off, heightening nutrient levels in the bay. The District of Columbia and New York also contribute to the Chesapeake’s nutrient load. Between the five states and one district, 500 large public and industrial waste-water treatment plants filter into the bay.

The battle to clean up the Chesapeake has been going on for over 30 years. In 1987, the federal government signed the Chesapeake Bay agreement, promising to reduce nutrients in the bay by 40 percent by 2000. When it missed that deadline, it set another one for 2010. The feds missed that one too.

In 2009, President Obama declared the Chesapeake Bay a national treasure, and in 2010 he signed an executive order to clean up the Chesapeake. That spurred the EPA to get serious, instituting a tough total maximum daily load (TMDL) schedule for all farms, waste treatment plants, and industrial plants in the five state area to be completed by 2025.

In Maryland, which has aggressive restoration policies, the state legislature instituted a storm-water fee. The tax specifically funds storm drains, collection ponds, stream restorations and other improvements that control and slow the flow of runoff.

Advertisement

In 2012, hypoxia in Chesapeake Bay was down along with nitrogen and phosphorus levels. In its summer 2012 report, the NOAA attributed the decline to nutrient reduction strategies implemented by Maryland Department of Natural Resources and the Maryland Department of the Environment.

But Mary-Ann Evans, a research ecologist at US Geological Survey, said nutrient loads depends heavily on weather. “Its hard to say nutrients are lower than last year because of something someone did versus a weather pattern,” she said. "If there’s less rainfall in a given year, it means fewer nutrients will make it into waterways.”

Long Island Sound

Another East Coast estuary that suffers from hypoxia is the Long Island Sound, which is home to New York City’s daily load of 1.4 billion gallons of treated wastewater. In recent years, the decreasing oxygen levels of the Long Island Sound have been compounded by changing weather patterns that have resulted in fewer winds to mix fresh oxygen into surface waters.

Via the EPA

At a lecture in March at Stony Brook University, Dr. Lawrence Swanson, associate dean of the School of Marine and Atmospheric Sciences, said that data show wind patterns are changing direction away from the Long Island Sound and decreasing in strength. He also noted a trend in temperatures rising earlier in the year and cooling later in the year, meaning there is a longer period of water stratification—a rift between warm and cool waters caused by a difference in water temperature and density. Oxygen is also less soluble in warmer waters.

Despite an EPA instituted TMDL to reduce nutrient levels by 58.5 percent and upgrades in wastewater treatment plans, water quality continues to be a large issue for the western basin of the Sound.

Advertisement

Great Lakes

Via NASA Earth Observatory

You may think the Great Lakes are natural candidates for dead zones. After all, they are enclosed bodies of water with major cities along their perimeters. So it may comes as a surprise that only two of the Great Lakes are really of concern: Lake Erie, and to a lesser extent, Lake Michigan.

Green Bay, though not named for algae blooms, is closed off from the rest of Lake Michigan by Wisconsin’s Door Peninsula, and receives roughly 33 percent of the lake's nutrient load and watershed. In the 1960s and 70s efforts to reduce phosphates significantly reduced hypoxic conditions, but that work has since been reversed. The increase in phosphorus is largely from non-point sources—places that are difficult to pinpoint, like farms and construction sites, whose nutrients enter the bay through storm water run-off. As of 2012, the EPA was reviewing recommendations for an actionable TMDL plan.

Lake Erie’s algae blooms date back thousands of years, according to the World Resources Institute's interactive eutrophication map. Hypoxification picked up in the 1960s because of increased phosphorus load, and Lake Erie now receives the most nutrient influx of any of the Great Lakes. And because it's shallow, it warms and cools earlier in the year, which leads to more water stratification. That means less mixing of oxygenated surface waters and low-oxygen waters near bottom. After nutrient problems that plagued the lack in the 60s and 70s were solved, Lake Erie is again in need of help.

Advertisement

The West Coast

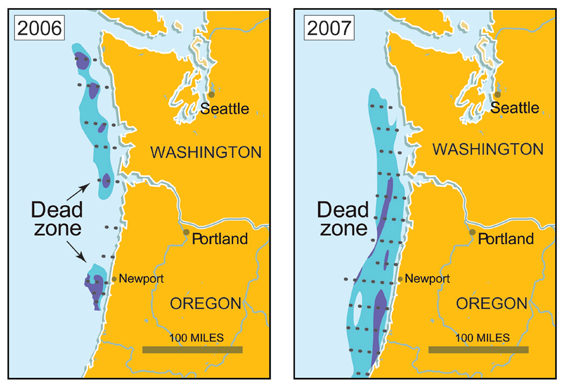
Dead zones on the northern Pacific coast are affected by
changing currents, which the US Global Change Research
Program notes can be influenced by climate change.

Hypoxia events on the West Coast increasingly appear to be influenced by a perfect storm (pun intended) of climate change, intense weather patterns, and upwelling.

Every year northerly wind in the spring blows surface water away from the shore and allows cooler deep waters to upwell, mixing oxygen from the surface with the nutrients laying at the bottom of the ocean. Calm periods allow things to stabilize, but when wind is continuously strong, it causes a constant upwelling, which leaves nutrients trapped in surface water. This increased nutrient load leads to algae blooms that boom and crash, sucking oxygen out of the water.

In 2010, Virginia Gewin detailed a bigger problem in Nature. Researchers at the University of Oregon found that beyond the continental shelf 600-1200 meters underwater is a permanently hypoxic zone. This is common for water at depths too low to mix with surface water. But in this particular hypoxic area (known as an oxygen minimum zone) could be expanding.

Waters above the OMZ, researchers say, show diminishing oxygen levels year after year. Climate change may be exacerbating the issue by creating a longer period of water stratification. Additionally, melting polar regions can weaken currents that usually bring cold oxygenated water to warmer regions.

Advertisement

What now?

Treating hypoxia is a perplexing task. “One of the difficulties in determining the cause and effect relationships in hypoxia is that there s a great level of variability like nutrient level and weather patterns or things that are beyond our control and because the systems are very large we can't do a controlled experiment,” said WRI's Selman.

And some solutions are more creative than others. Last year, the Swedish government was looking into pumping oxygen rich surface water to the bottom of the sea using wind turbines.

Mary Ann Evans at the United States Geological Survey has her doubts about that project. "Between density differences in water and the amounts of water involved, it would take a great deal of energy, like hurricane amounts of energy, to mix these waters," she said.

Another proposal by the World Resources Institute is nutrient trading, which essentially mimics emissions cap and trade programs. The Institute proposed using such a system in Chesapeake Bay, where unifying regulation across the Bay's nine states and districts can be difficult.

The reality is nutrient sources are hard to track and control especially in the face of increasingly intense weather patterns. And for researchers there’s still a lot of white noise. “Digging into the the cause and effect relationships is made complicated because we see the variability rather than the trend,” said Mary-Ann Evans at USGS. That high degree of variability makes building mitigation plans difficult. More research will help, as will more political support. With dead zones popping up around the country, it can't come soon enough.